Serverless MikroTik Monitoring with SNMP and AWS CloudWatch
The Problem with Traditional Network Monitoring
If you run MikroTik routers in a home lab, remote office, or hybrid cloud setup, you’ve probably reached for Zabbix, Nagios, or Grafana+Prometheus at some point. These tools work, but they come with a cost — you need a dedicated host, ongoing maintenance, and yet another dashboard to manage alongside your AWS Console.
What if your router metrics could live right next to your EC2, RDS, and Lambda metrics in CloudWatch? No extra servers, no separate SaaS subscription — just a Lambda function running on a schedule, polling SNMP, and shipping data where you already look.
That’s exactly what the terraform-aws-mikrotik-snmp-to-cloudwatch module does.
How It Works
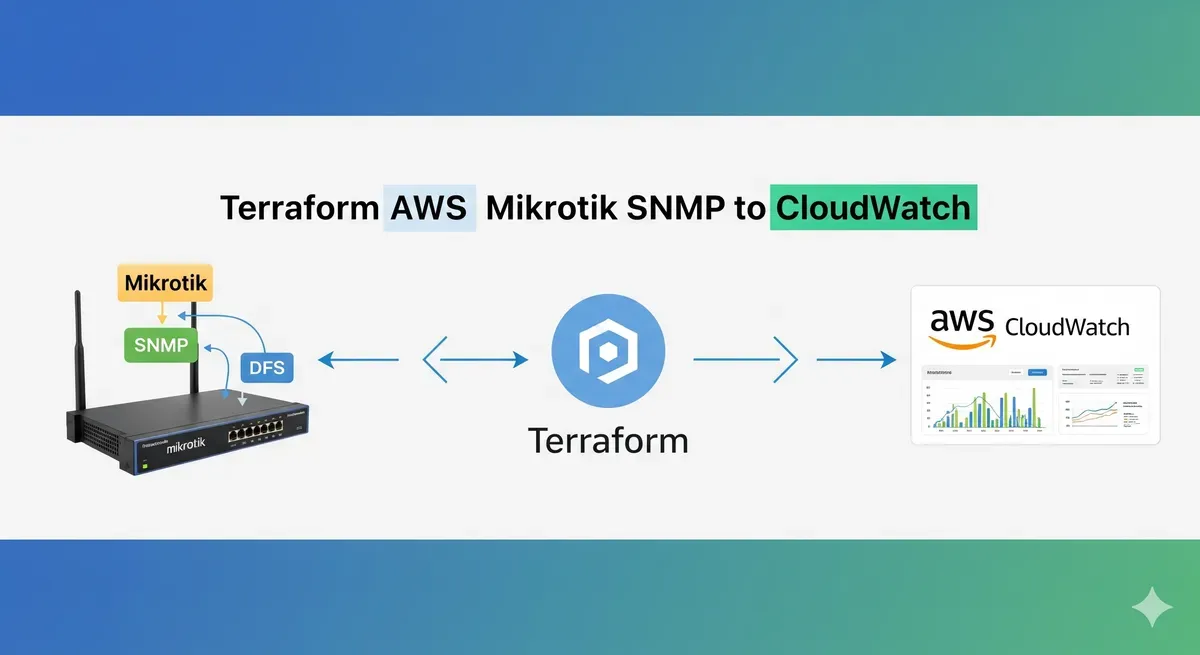
The module provisions three AWS resources:
EventBridge Schedule → Lambda (Python + SNMP) → CloudWatch Metrics- EventBridge triggers the Lambda on a configurable schedule (default: every 5 minutes).
- Lambda runs a Python SNMP query against your target device using the community string you provide.
- Metrics land in a CloudWatch custom namespace you define — ready for dashboards, alarms, and anomaly detection.
An optional IAM role is created with the minimum permissions needed: cloudwatch:PutMetricData and, when using VPC mode, the standard AWSLambdaVPCAccessExecutionRole.
Prerequisites
Before deploying, make sure you have:
- Terraform
>= 1.2 - AWS Provider
>= 4.0 - Docker — required to package the Python Lambda with its
pysnmpdependency - SNMP enabled on your MikroTik (or any other SNMP v1/v2c device)
- Network path from Lambda to the device on UDP port 161
MikroTik tip: Enable SNMP under
IP → SNMPin Winbox, or via the CLI:/snmp set enabled=yes /snmp community add name=private addresses=0.0.0.0/0
Basic Usage
For a device reachable from the Lambda’s default network (e.g., a VPN-connected router or a device with a public IP):
module "mikrotik_snmp" {
  source  = "KamranBiglari/mikrotik-snmp-to-cloudwatch/aws"
  version = "~> 1.0"

  router_ip            = "192.168.88.1"
  snmp_communities     = ["private"]
  cloudwatch_namespace = "MikroTik"

  snmp_oids = [
    "1.3.6.1.2.1.1.3.0",            # System uptime
    "1.3.6.1.4.1.14988.1.1.3.10.0", # CPU load (%)
    "1.3.6.1.2.1.2.2.1.10.1",       # Interface bytes in
    "1.3.6.1.2.1.2.2.1.16.1"        # Interface bytes out
  ]
}
Run terraform init && terraform apply and metrics will start appearing in CloudWatch within a few minutes.
VPC Deployment (Private Networks)
If your router is on a private subnet that Lambda can’t reach by default, enable VPC mode:
module "mikrotik_snmp" {
  source  = "KamranBiglari/mikrotik-snmp-to-cloudwatch/aws"
  version = "~> 1.0"

  router_ip            = "10.0.1.1"
  snmp_communities     = ["private"]
  cloudwatch_namespace = "MikroTik"

  snmp_oids = [
    "1.3.6.1.2.1.1.3.0",
    "1.3.6.1.4.1.14988.1.1.3.10.0"
  ]

  # VPC configuration
  vpc_subnet_ids        = ["subnet-aaa111", "subnet-bbb222"]
  vpc_id                = "vpc-abcdef12"
  create_security_group = true
}
The module will create a security group that allows outbound UDP 161 to the router IP and associate it with the Lambda function.
Common MikroTik OIDs
Here are the OIDs I find most useful when monitoring a MikroTik router:
| Metric | OID |
|---|---|
| System uptime | 1.3.6.1.2.1.1.3.0 |
| CPU load (%) | 1.3.6.1.4.1.14988.1.1.3.10.0 |
| Free memory (bytes) | 1.3.6.1.4.1.14988.1.1.3.11.0 |
| Total memory (bytes) | 1.3.6.1.4.1.14988.1.1.3.12.0 |
| Interface bytes in (ether1) | 1.3.6.1.2.1.2.2.1.10.1 |
| Interface bytes out (ether1) | 1.3.6.1.2.1.2.2.1.16.1 |
| Active connections | 1.3.6.1.4.1.14988.1.1.3.3.0 |
| Voltage | 1.3.6.1.4.1.14988.1.1.3.8.0 |
| Temperature | 1.3.6.1.4.1.14988.1.1.3.9.0 |
You can browse all MikroTik OIDs by loading the MikroTik MIB files into a tool like
snmpwalkor MIB Browser.
Viewing Metrics in CloudWatch
After the first Lambda invocation, navigate to:
CloudWatch → Metrics → All metrics → Custom namespaces → MikroTik
From there you can:
- Build a dashboard combining router metrics with your AWS service metrics
- Set alarms — for example, alert when CPU exceeds 80% for 10 minutes
- Use Metric Math to calculate bandwidth in Mbps from raw byte counters
- Enable Anomaly Detection to catch unusual traffic spikes
Cost Breakdown
Running at the default 5-minute interval (288 invocations/day):
| Resource | Monthly Cost |
|---|---|
| Lambda invocations | Free (well within free tier) |
| CloudWatch custom metrics | ~$0.30 per metric/month |
| CloudWatch Logs | ~$1/month |
| EventBridge | Free |
| Total (4 OIDs) | ~$2–3/month |
Compare that to the EC2 or ECS cost of running a dedicated monitoring host 24/7 — the serverless approach wins on cost for simple polling use cases.
Source Code
The full module source, including the Lambda Python handler and all Terraform configuration, is on GitHub:
github.com/KamranBiglari/terraform-aws-mikrotik-snmp-to-cloudwatch
It’s also published to the Terraform Registry:
source = "KamranBiglari/mikrotik-snmp-to-cloudwatch/aws"Issues, PRs, and feedback are welcome.
Wrapping Up
If you’re already running workloads on AWS and want basic visibility into your network gear without spinning up another monitoring stack, this module gives you a clean, low-cost path. SNMP support is broad — while the module is named for MikroTik, any SNMPv1/v2c device (Ubiquiti, Cisco, Juniper, generic Linux hosts) will work the same way.
Give it a try, and let me know if there are OIDs or features you’d like to see added.