Integrate Hetzner Cloud Metrics into AWS CloudWatch with Terraform
In modern cloud architectures, organizations often leverage multiple cloud providers to optimize costs, avoid vendor lock-in, or utilize specific regional advantages. Hetzner Cloud offers exceptional price-performance for compute and networking, while AWS provides unmatched breadth in managed services and global infrastructure.
However, managing a hybrid cloud environment introduces a critical challenge: fragmented monitoring. Your operations team needs to context-switch between Hetzner’s monitoring interface and AWS CloudWatch, making it difficult to establish unified alerting, dashboards, and observability practices.
In this comprehensive guide, I’ll show you how to integrate Hetzner Cloud metrics into AWS CloudWatch using a serverless Terraform module that leverages Step Functions, EventBridge, and the Hetzner Cloud API.
The Hybrid Cloud Monitoring Challenge
The Problem
Organizations running hybrid infrastructure across Hetzner and AWS face several monitoring challenges:
1. Monitoring Fragmentation
- Hetzner metrics in Hetzner Cloud Console
- AWS metrics in CloudWatch
- No single pane of glass for infrastructure health
- Different metric formats and retention policies
2. Alerting Complexity
- Separate alerting systems (Hetzner vs CloudWatch Alarms)
- Inconsistent notification channels
- Difficult to correlate cross-cloud issues
- Complex on-call workflows
3. Compliance & Governance
- Centralized logging requirements for auditing
- Unified retention policies across providers
- Consolidated cost tracking for observability
4. Operational Overhead
- Training teams on multiple monitoring platforms
- Maintaining separate dashboards and runbooks
- Higher MTTR (Mean Time To Resolution) for incidents
The Solution: Centralized Monitoring in CloudWatch
By integrating Hetzner metrics into AWS CloudWatch, you gain:
- Unified Dashboards: Single CloudWatch dashboard showing all infrastructure
- Consistent Alerting: CloudWatch Alarms for both AWS and Hetzner resources
- Correlation: Easy correlation between Hetzner and AWS metrics
- Automation: Leverage AWS native tools (Lambda, EventBridge, SNS) for all alerting
- Cost Efficiency: Consolidated observability stack reduces tool sprawl
- Compliance: Centralized metric storage meeting retention requirements
Architecture Overview
The solution uses a serverless, event-driven architecture to periodically fetch metrics from Hetzner Cloud API and publish them to CloudWatch:
┌─────────────────────────────────────────────────────────────────┐
│                    Hetzner Cloud (External)                      │
│  ┌──────────────┐  ┌──────────────┐  ┌──────────────┐          │
│  │ Load Balancer│  │   Server 1   │  │   Server 2   │          │
│  │  (Metrics)   │  │  (Metrics)   │  │  (Metrics)   │          │
│  └──────────────┘  └──────────────┘  └──────────────┘          │
└────────────────────┬────────────────────────────────────────────┘
                     │ Hetzner Cloud API
                     │ (Bearer Token Auth)
                     ▼
┌─────────────────────────────────────────────────────────────────┐
│                         AWS Account                              │
│                                                                  │
│  ┌───────────────────────────────────────────────────────┐     │
│  │          EventBridge Scheduler (Optional)              │     │
│  │        Trigger: rate(5 minutes) or cron               │     │
│  └───────────────────┬───────────────────────────────────┘     │
│                      │                                           │
│                      ▼                                           │
│  ┌───────────────────────────────────────────────────────┐     │
│  │           AWS Step Functions State Machine             │     │
│  │  ┌─────────────────────────────────────────────────┐  │     │
│  │  │ 1. Retrieve API Token from Secrets Manager      │  │     │
│  │  │    (via EventBridge Connection)                 │  │     │
│  │  └─────────────────────────────────────────────────┘  │     │
│  │  ┌─────────────────────────────────────────────────┐  │     │
│  │  │ 2. Fetch Metrics from Hetzner Cloud API         │  │     │
│  │  │    - GET /load_balancers/{id}/metrics           │  │     │
│  │  │    - GET /servers/{id}/metrics                  │  │     │
│  │  └─────────────────────────────────────────────────┘  │     │
│  │  ┌─────────────────────────────────────────────────┐  │     │
│  │  │ 3. Transform Metrics to CloudWatch Format       │  │     │
│  │  └─────────────────────────────────────────────────┘  │     │
│  │  ┌─────────────────────────────────────────────────┐  │     │
│  │  │ 4. Publish to CloudWatch Custom Metrics         │  │     │
│  │  │    - Namespace: HetznerLoadBalancer/HetznerServer│ │     │
│  │  │    - Dimensions: LoadBalancerId/ServerId        │  │     │
│  │  └─────────────────────────────────────────────────┘  │     │
│  └───────────────────────────────────────────────────────┘     │
│                      │                                           │
│                      ▼                                           │
│  ┌───────────────────────────────────────────────────────┐     │
│  │              AWS CloudWatch Metrics                    │     │
│  │  • HetznerLoadBalancer/* (connections, requests, BW)   │     │
│  │  • HetznerServer/* (CPU, disk I/O, network)           │     │
│  └───────────────────────────────────────────────────────┘     │
│                                                                  │
│  ┌───────────────────────────────────────────────────────┐     │
│  │         CloudWatch Dashboards & Alarms                 │     │
│  │  Unified view of AWS + Hetzner infrastructure         │     │
│  └───────────────────────────────────────────────────────┘     │
└─────────────────────────────────────────────────────────────────┘
Key Components
- EventBridge Connection: Securely stores Hetzner Cloud API token using AWS Secrets Manager
- EventBridge Scheduler: Triggers metric collection on a schedule (e.g., every 5 minutes)
- Step Functions State Machine: Orchestrates the metric collection workflow
- Hetzner Cloud API: Source of truth for infrastructure metrics
- CloudWatch Custom Metrics: Storage for Hetzner metrics in AWS
- IAM Roles: Least-privilege permissions for Step Functions execution
Supported Hetzner Metrics
Load Balancer Metrics
The module collects comprehensive load balancer performance data:
| Metric Name | CloudWatch Metric | Description | Unit |
|---|---|---|---|
open_connections | OpenConnections | Current number of active connections | Count |
connections_per_second | ConnectionsPerSecond | New connections established per second | Count/Second |
requests_per_second | RequestsPerSecond | HTTP/HTTPS requests handled per second | Count/Second |
bandwidth.in | BandwidthIn | Inbound network bandwidth | Bytes/Second |
bandwidth.out | BandwidthOut | Outbound network bandwidth | Bytes/Second |
Example Use Cases:
- Monitor connection pool saturation
- Alert on traffic spikes
- Track request rate patterns
- Identify bandwidth bottlenecks
- Capacity planning for load balancers
Server Metrics
Comprehensive server performance and resource utilization:
| Metric Name | CloudWatch Metric | Description | Unit |
|---|---|---|---|
cpu | CPUUtilization | CPU usage percentage | Percent |
disk.0.iops.read | DiskReadIOPS | Disk read operations per second | Count/Second |
disk.0.iops.write | DiskWriteIOPS | Disk write operations per second | Count/Second |
disk.0.bandwidth.read | DiskReadBandwidth | Disk read throughput | Bytes/Second |
disk.0.bandwidth.write | DiskWriteBandwidth | Disk write throughput | Bytes/Second |
network.0.bandwidth.in | NetworkIn | Inbound network bandwidth | Bytes/Second |
network.0.bandwidth.out | NetworkOut | Outbound network bandwidth | Bytes/Second |
network.0.pps.in | NetworkPacketsIn | Inbound packets per second | Count/Second |
network.0.pps.out | NetworkPacketsOut | Outbound packets per second | Count/Second |
Example Use Cases:
- Monitor CPU utilization trends
- Alert on disk I/O saturation
- Track network throughput
- Identify noisy neighbor issues
- Optimize instance sizing
Quick Start: Deploy in 10 Minutes
Prerequisites
Before deploying, ensure you have:
- Hetzner Cloud Account with API access
- Hetzner Cloud API Token (Read-only permissions sufficient)
- AWS Account with permissions for:
- Step Functions
- CloudWatch
- EventBridge
- IAM
- Secrets Manager
- Terraform >= 1.0 installed locally
Step 1: Generate Hetzner Cloud API Token
Create a read-only API token in Hetzner Cloud Console:
# Navigate to: https://console.hetzner.cloud/
# → Select your project
# → Security → API Tokens
# → Generate API Token
#   - Description: "CloudWatch Integration (Read-Only)"
#   - Permissions: Read
#   - Copy the token (you won't see it again!)
Security Best Practice: Use read-only tokens. The integration only needs to fetch metrics, not modify resources.
Step 2: Get Hetzner Resource IDs
Find your load balancer or server IDs:
# Install Hetzner CLI (optional)
brew install hcloud  # macOS
# Or download from: https://github.com/hetznercloud/cli/releases

# Login
hcloud context create monitoring

# List load balancers
hcloud load-balancer list

# Output:
# ID        NAME            IPV4              TYPE    LOCATION
# 123456    production-lb   95.217.1.100      lb11    nbg1

# List servers
hcloud server list

# Output:
# ID        NAME         STATUS    IPV4             TYPE      DATACENTER
# 789012    web-01       running   95.217.1.101     cx21      nbg1-dc3
# 789013    web-02       running   95.217.1.102     cx21      nbg1-dc3
Note the resource IDs (e.g., 123456 for load balancer, 789012 for server).
Step 3: Create Terraform Configuration
Create a new directory and main.tf:
terraform {
  required_version = ">= 1.0"

  required_providers {
    aws = {
      source  = "hashicorp/aws"
      version = "~> 5.0"
    }
  }
}

provider "aws" {
  region = "eu-central-1"  # Frankfurt - close to Hetzner Germany
}

# Store Hetzner API token securely
variable "hetzner_api_token" {
  description = "Hetzner Cloud API token (read-only)"
  type        = string
  sensitive   = true
}

# Monitor Hetzner Load Balancer
module "hetzner_lb_metrics" {
  source  = "KamranBiglari/hetzner-cloudwatch-integration/aws"
  version = "~> 1.0"

  # API Authentication
  hetzner_cloud_api_token = var.hetzner_api_token

  # Metric Configuration
  metric_type = "loadbalancer"
  name        = "production-lb-metrics"

  # Resource to Monitor
  data = {
    loadbalancer_id = "123456"  # Replace with your LB ID
  }

  # Scheduling
  create_scheduler    = true
  schedule_expression = "rate(5 minutes)"

  tags = {
    Environment = "production"
    ManagedBy   = "terraform"
    Purpose     = "hetzner-monitoring"
  }
}

# Monitor Hetzner Server
module "hetzner_server_metrics" {
  source  = "KamranBiglari/hetzner-cloudwatch-integration/aws"
  version = "~> 1.0"

  # Reuse the same EventBridge Connection (API token) from LB module
  create_event_connection = false
  event_connection_arn    = module.hetzner_lb_metrics.event_connection_arn

  # Metric Configuration
  metric_type = "server"
  name        = "web-01-metrics"

  # Resource to Monitor
  data = {
    server_id = "789012"  # Replace with your server ID
  }

  # Scheduling
  create_scheduler    = true
  schedule_expression = "rate(5 minutes)"

  tags = {
    Environment = "production"
    ManagedBy   = "terraform"
    ServerName  = "web-01"
  }
}

# Outputs
output "lb_state_machine_arn" {
  value       = module.hetzner_lb_metrics.state_machine_arn
  description = "Step Functions state machine ARN for load balancer metrics"
}

output "server_state_machine_arn" {
  value       = module.hetzner_server_metrics.state_machine_arn
  description = "Step Functions state machine ARN for server metrics"
}

output "cloudwatch_namespaces" {
  value = {
    loadbalancer = "HetznerLoadBalancer"
    server       = "HetznerServer"
  }
  description = "CloudWatch namespaces where metrics are published"
}
Create terraform.tfvars:
hetzner_api_token = "your-hetzner-api-token-here"Security Note: Add terraform.tfvars to .gitignore to prevent committing secrets.
Step 4: Deploy the Integration
# Initialize Terraform
terraform init

# Review planned changes
terraform plan

# Deploy the integration
terraform apply -auto-approve
Deployment takes approximately 1-2 minutes and creates:
- 2 EventBridge Connections (or 1 if reusing)
- 2 Step Functions State Machines
- 2 EventBridge Scheduler rules
- IAM roles and policies
- CloudWatch Log Groups
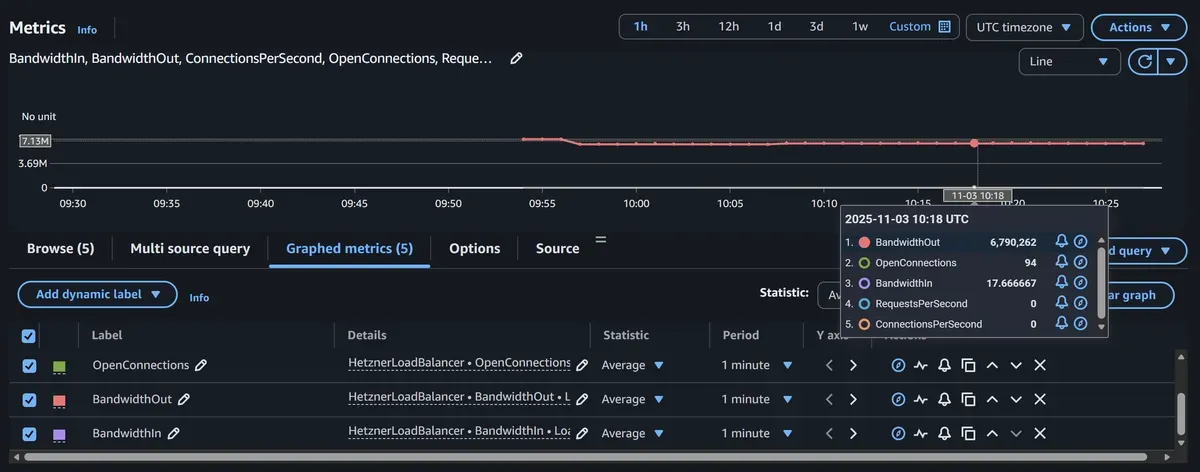
Step 5: Verify Metrics Collection
Wait 5-10 minutes for the first metrics to appear, then verify:
# List available metrics for load balancer
aws cloudwatch list-metrics \
  --namespace HetznerLoadBalancer \
  --dimensions Name=LoadBalancerId,Value=123456

# Expected output:
# {
#     "Metrics": [
#         {
#             "Namespace": "HetznerLoadBalancer",
#             "MetricName": "OpenConnections",
#             "Dimensions": [{"Name": "LoadBalancerId", "Value": "123456"}]
#         },
#         {
#             "Namespace": "HetznerLoadBalancer",
#             "MetricName": "RequestsPerSecond",
#             "Dimensions": [{"Name": "LoadBalancerId", "Value": "123456"}]
#         }
#         // ... more metrics
#     ]
# }

# Get recent CPU metrics for server
aws cloudwatch get-metric-statistics \
  --namespace HetznerServer \
  --metric-name CPUUtilization \
  --dimensions Name=ServerId,Value=789012 \
  --start-time $(date -u -d '1 hour ago' +%Y-%m-%dT%H:%M:%S) \
  --end-time $(date -u +%Y-%m-%dT%H:%M:%S) \
  --period 300 \
  --statistics Average

# Expected output:
# {
#     "Datapoints": [
#         {
#             "Timestamp": "2026-02-16T10:00:00Z",
#             "Average": 23.5,
#             "Unit": "Percent"
#         },
#         {
#             "Timestamp": "2026-02-16T10:05:00Z",
#             "Average": 25.1,
#             "Unit": "Percent"
#         }
#         // ... more datapoints
#     ]
# }

# Check Step Functions execution history
aws stepfunctions list-executions \
  --state-machine-arn $(terraform output -raw lb_state_machine_arn) \
  --max-results 5
Advanced Configuration Patterns
Pattern 1: Multi-Server Monitoring with Shared Connection
Monitor multiple servers efficiently by reusing a single EventBridge Connection:
# Create shared connection
module "hetzner_connection" {
  source  = "KamranBiglari/hetzner-cloudwatch-integration/aws"
  version = "~> 1.0"

  hetzner_cloud_api_token = var.hetzner_api_token

  # Only create the connection, no scheduler
  create_scheduler = false
  metric_type      = "server"
  name             = "shared-connection"

  data = {
    server_id = "0"  # Placeholder
  }
}

# Monitor multiple servers using the shared connection
module "web_servers" {
  source   = "KamranBiglari/hetzner-cloudwatch-integration/aws"
  version  = "~> 1.0"
  for_each = toset(["789012", "789013", "789014"])

  # Reuse connection
  create_event_connection = false
  event_connection_arn    = module.hetzner_connection.event_connection_arn

  metric_type = "server"
  name        = "web-server-${each.key}"

  data = {
    server_id = each.key
  }

  create_scheduler    = true
  schedule_expression = "rate(5 minutes)"
}
Pattern 2: Environment-Based Monitoring
Different collection frequencies for prod vs non-prod:
variable "environment" {
  type    = string
  default = "production"
}

locals {
  schedule_by_env = {
    production = "rate(5 minutes)"   # High frequency for production
    staging    = "rate(15 minutes)"  # Medium frequency for staging
    development = "rate(30 minutes)" # Low frequency for dev
  }

  servers_by_env = {
    production  = ["789012", "789013", "789014"]
    staging     = ["789020"]
    development = ["789030"]
  }
}

module "server_metrics" {
  source   = "KamranBiglari/hetzner-cloudwatch-integration/aws"
  version  = "~> 1.0"
  for_each = toset(local.servers_by_env[var.environment])

  hetzner_cloud_api_token = var.hetzner_api_token

  metric_type = "server"
  name        = "${var.environment}-server-${each.key}"

  data = {
    server_id = each.key
  }

  create_scheduler    = true
  schedule_expression = local.schedule_by_env[var.environment]

  tags = {
    Environment = var.environment
  }
}
Pattern 3: Custom IAM Role with Additional Permissions
Use a custom IAM role with additional permissions (e.g., SNS for alerting):
# Create custom IAM role
resource "aws_iam_role" "custom_sfn_role" {
  name = "hetzner-cloudwatch-custom-role"

  assume_role_policy = jsonencode({
    Version = "2012-10-17"
    Statement = [
      {
        Effect = "Allow"
        Principal = {
          Service = "states.amazonaws.com"
        }
        Action = "sts:AssumeRole"
      }
    ]
  })
}

# Attach basic CloudWatch permissions
resource "aws_iam_role_policy" "cloudwatch_metrics" {
  role = aws_iam_role.custom_sfn_role.id

  policy = jsonencode({
    Version = "2012-10-17"
    Statement = [
      {
        Effect = "Allow"
        Action = [
          "cloudwatch:PutMetricData"
        ]
        Resource = "*"
        Condition = {
          StringEquals = {
            "cloudwatch:namespace" = [
              "HetznerLoadBalancer",
              "HetznerServer"
            ]
          }
        }
      },
      {
        Effect = "Allow"
        Action = [
          "events:RetrieveConnectionCredentials"
        ]
        Resource = module.hetzner_lb_metrics.event_connection_arn
      }
    ]
  })
}

# Attach additional permissions (e.g., SNS for alerting within Step Functions)
resource "aws_iam_role_policy" "sns_publish" {
  role = aws_iam_role.custom_sfn_role.id

  policy = jsonencode({
    Version = "2012-10-17"
    Statement = [
      {
        Effect = "Allow"
        Action = [
          "sns:Publish"
        ]
        Resource = aws_sns_topic.hetzner_alerts.arn
      }
    ]
  })
}

# Use the custom role
module "hetzner_lb_metrics" {
  source  = "KamranBiglari/hetzner-cloudwatch-integration/aws"
  version = "~> 1.0"

  hetzner_cloud_api_token = var.hetzner_api_token

  # Use custom IAM role
  create_role = false
  role_arn    = aws_iam_role.custom_sfn_role.arn

  metric_type = "loadbalancer"
  name        = "production-lb-metrics"

  data = {
    loadbalancer_id = "123456"
  }

  create_scheduler    = true
  schedule_expression = "rate(5 minutes)"
}
Pattern 4: Cron-Based Scheduling
Use cron expressions for precise scheduling:
module "hetzner_server_metrics" {
  source  = "KamranBiglari/hetzner-cloudwatch-integration/aws"
  version = "~> 1.0"

  hetzner_cloud_api_token = var.hetzner_api_token

  metric_type = "server"
  name        = "web-01-metrics"

  data = {
    server_id = "789012"
  }

  create_scheduler = true

  # Collect metrics every 5 minutes during business hours (UTC)
  # Monday-Friday, 8 AM - 6 PM UTC
  schedule_expression = "cron(*/5 8-18 ? * MON-FRI *)"

  # Or collect every minute during peak hours
  # schedule_expression = "cron(* 12-14 ? * * *)"

  # Or daily summary at midnight
  # schedule_expression = "cron(0 0 * * ? *)"
}
Creating CloudWatch Dashboards
Unified Hybrid Cloud Dashboard
Create a comprehensive dashboard showing both AWS and Hetzner resources:
{
  "widgets": [
    {
      "type": "metric",
      "properties": {
        "metrics": [
          ["HetznerLoadBalancer", "RequestsPerSecond", {"stat": "Average", "label": "Hetzner LB Requests"}],
          ["AWS/ApplicationELB", "RequestCount", {"stat": "Sum", "label": "AWS ALB Requests"}]
        ],
        "view": "timeSeries",
        "stacked": false,
        "region": "eu-central-1",
        "title": "Load Balancer Traffic (Hybrid)",
        "period": 300,
        "yAxis": {
          "left": {
            "label": "Requests/sec",
            "showUnits": false
          }
        }
      }
    },
    {
      "type": "metric",
      "properties": {
        "metrics": [
          ["HetznerServer", "CPUUtilization", {"dimensions": {"ServerId": "789012"}, "label": "Hetzner Web-01"}],
          ["HetznerServer", "CPUUtilization", {"dimensions": {"ServerId": "789013"}, "label": "Hetzner Web-02"}],
          ["AWS/EC2", "CPUUtilization", {"dimensions": {"InstanceId": "i-1234567890abcdef0"}, "label": "AWS Web-01"}]
        ],
        "view": "timeSeries",
        "stacked": false,
        "region": "eu-central-1",
        "title": "Server CPU Utilization (All Clouds)",
        "period": 300,
        "yAxis": {
          "left": {
            "min": 0,
            "max": 100,
            "label": "Percent",
            "showUnits": false
          }
        }
      }
    },
    {
      "type": "metric",
      "properties": {
        "metrics": [
          ["HetznerServer", "NetworkIn", {"stat": "Average"}],
          ["HetznerServer", "NetworkOut", {"stat": "Average"}]
        ],
        "view": "timeSeries",
        "stacked": false,
        "region": "eu-central-1",
        "title": "Hetzner Network Bandwidth",
        "period": 300,
        "yAxis": {
          "left": {
            "label": "Bytes/sec",
            "showUnits": false
          }
        }
      }
    },
    {
      "type": "metric",
      "properties": {
        "metrics": [
          ["HetznerLoadBalancer", "OpenConnections", {"stat": "Maximum"}]
        ],
        "view": "singleValue",
        "region": "eu-central-1",
        "title": "Current Connections",
        "period": 300
      }
    }
  ]
}
Save as hetzner-dashboard.json and create:
aws cloudwatch put-dashboard \
  --dashboard-name HybridCloudMonitoring \
  --dashboard-body file://hetzner-dashboard.json
Access the dashboard in AWS Console:
https://console.aws.amazon.com/cloudwatch/home?region=eu-central-1#dashboards:name=HybridCloudMonitoringTerraform-Managed Dashboard
Alternatively, manage dashboards as code:
resource "aws_cloudwatch_dashboard" "hybrid_monitoring" {
  dashboard_name = "HybridCloudInfrastructure"

  dashboard_body = jsonencode({
    widgets = [
      {
        type = "metric"
        properties = {
          metrics = [
            ["HetznerServer", "CPUUtilization", { dimensions = { ServerId = "789012" } }],
            ["HetznerServer", "CPUUtilization", { dimensions = { ServerId = "789013" } }]
          ]
          view   = "timeSeries"
          region = "eu-central-1"
          title  = "Hetzner Servers CPU"
          period = 300
        }
      },
      {
        type = "metric"
        properties = {
          metrics = [
            ["HetznerLoadBalancer", "RequestsPerSecond"],
            ["HetznerLoadBalancer", "ConnectionsPerSecond"]
          ]
          view   = "timeSeries"
          region = "eu-central-1"
          title  = "Load Balancer Performance"
          period = 300
        }
      }
    ]
  })
}
Setting Up CloudWatch Alarms
High CPU Alarm
Alert when Hetzner server CPU exceeds threshold:
resource "aws_cloudwatch_metric_alarm" "hetzner_high_cpu" {
  alarm_name          = "hetzner-web-01-high-cpu"
  comparison_operator = "GreaterThanThreshold"
  evaluation_periods  = 2
  metric_name         = "CPUUtilization"
  namespace           = "HetznerServer"
  period              = 300
  statistic           = "Average"
  threshold           = 80
  alarm_description   = "Alert when Hetzner server CPU exceeds 80%"
  treat_missing_data  = "notBreaching"

  dimensions = {
    ServerId = "789012"
  }

  alarm_actions = [aws_sns_topic.infrastructure_alerts.arn]
  ok_actions    = [aws_sns_topic.infrastructure_alerts.arn]
}
Load Balancer Connection Spike
Detect unusual connection spikes:
resource "aws_cloudwatch_metric_alarm" "lb_connection_spike" {
  alarm_name          = "hetzner-lb-connection-spike"
  comparison_operator = "GreaterThanThreshold"
  evaluation_periods  = 1
  metric_name         = "ConnectionsPerSecond"
  namespace           = "HetznerLoadBalancer"
  period              = 300
  statistic           = "Average"
  threshold           = 1000
  alarm_description   = "Alert on unusual connection spike (potential DDoS)"

  dimensions = {
    LoadBalancerId = "123456"
  }

  alarm_actions = [aws_sns_topic.security_alerts.arn]
}
Disk I/O Saturation
Monitor disk performance bottlenecks:
resource "aws_cloudwatch_metric_alarm" "high_disk_iops" {
  alarm_name          = "hetzner-server-high-disk-iops"
  comparison_operator = "GreaterThanThreshold"
  evaluation_periods  = 3
  metric_name         = "DiskWriteIOPS"
  namespace           = "HetznerServer"
  period              = 300
  statistic           = "Average"
  threshold           = 5000
  alarm_description   = "Alert when disk write IOPS exceeds capacity"

  dimensions = {
    ServerId = "789012"
  }

  alarm_actions = [aws_sns_topic.infrastructure_alerts.arn]
}
Composite Alarm: Server Health
Combine multiple conditions:
resource "aws_cloudwatch_composite_alarm" "server_health" {
  alarm_name          = "hetzner-web-01-health"
  alarm_description   = "Composite alarm for overall server health"
  actions_enabled     = true
  alarm_actions       = [aws_sns_topic.critical_alerts.arn]

  alarm_rule = "ALARM(${aws_cloudwatch_metric_alarm.hetzner_high_cpu.alarm_name}) OR ALARM(${aws_cloudwatch_metric_alarm.high_disk_iops.alarm_name})"
}
Monitoring Step Functions Execution
Track Integration Health
Monitor the metric collection pipeline itself:
# Alarm on Step Functions execution failures
resource "aws_cloudwatch_metric_alarm" "sfn_execution_failed" {
  alarm_name          = "hetzner-metrics-collection-failure"
  comparison_operator = "GreaterThanThreshold"
  evaluation_periods  = 1
  metric_name         = "ExecutionsFailed"
  namespace           = "AWS/States"
  period              = 300
  statistic           = "Sum"
  threshold           = 0
  alarm_description   = "Alert when metric collection fails"

  dimensions = {
    StateMachineArn = module.hetzner_lb_metrics.state_machine_arn
  }

  alarm_actions = [aws_sns_topic.infrastructure_alerts.arn]
}

# Monitor execution duration
resource "aws_cloudwatch_metric_alarm" "sfn_slow_execution" {
  alarm_name          = "hetzner-metrics-slow-collection"
  comparison_operator = "GreaterThanThreshold"
  evaluation_periods  = 2
  metric_name         = "ExecutionTime"
  namespace           = "AWS/States"
  period              = 300
  statistic           = "Average"
  threshold           = 10000  # 10 seconds
  alarm_description   = "Alert when metric collection is slow"

  dimensions = {
    StateMachineArn = module.hetzner_server_metrics.state_machine_arn
  }

  alarm_actions = [aws_sns_topic.infrastructure_alerts.arn]
}
Query Step Functions Logs
Check CloudWatch Logs for execution details:
# Get the log group for Step Functions
LOG_GROUP="/aws/vendedlogs/states/hetzner-metrics"

# Query recent executions
aws logs filter-log-events \
  --log-group-name "$LOG_GROUP" \
  --start-time $(date -d '1 hour ago' +%s)000 \
  --filter-pattern "{ $.type = \"ExecutionSucceeded\" }"

# Query failed executions
aws logs filter-log-events \
  --log-group-name "$LOG_GROUP" \
  --filter-pattern "{ $.type = \"ExecutionFailed\" }" \
  --max-items 10
Cost Analysis
Pricing Breakdown
Components and Monthly Costs (us-east-1 pricing, 5-minute intervals):
1. Step Functions State Transitions
Executions per month: (60 min / 5 min) × 24 hours × 30 days = 8,640 executions
Cost: 8,640 × $0.000025 = $0.22/month per resource
2. CloudWatch Custom Metrics
Metrics per resource:
- Load Balancer: 5 metrics
- Server: 9 metrics

Cost per metric: $0.30/month
Load Balancer cost: 5 × $0.30 = $1.50/month
Server cost: 9 × $0.30 = $2.70/month
3. CloudWatch API Requests
PutMetricData calls: 8,640 executions × 1 API call = 8,640 requests
First 1M requests free, so: $0/month
4. AWS Secrets Manager (via EventBridge Connection)
1 secret (Hetzner API token): $0.40/month
API calls: 8,640 × $0.05 per 10,000 = $0.04/month
Total Secrets Manager: $0.44/month
5. EventBridge Scheduler
Invocations: 8,640/month
First 14M invocations free, so: $0/month
Total Monthly Cost per Resource:
- Load Balancer: $0.22 (SFN) + $1.50 (CW) + $0.44 (Secrets) = $2.16/month
- Server: $0.22 (SFN) + $2.70 (CW) + $0.44 (Secrets) = $3.36/month
Cost Sharing: When monitoring multiple resources with a shared EventBridge Connection, the $0.44 Secrets Manager cost is shared, reducing per-resource costs.
Example: 10 Servers + 2 Load Balancers
Step Functions: 12 × $0.22 = $2.64
CloudWatch Metrics: (2 × $1.50) + (10 × $2.70) = $30.00
Secrets Manager: $0.44 (shared)
Total: $33.08/month
Cost Optimization Strategies
1. Adjust Collection Frequency
Non-critical resources don’t need 5-minute granularity:
# Production: 5-minute intervals
schedule_expression = "rate(5 minutes)"   # $2.16/month per LB

# Development: 30-minute intervals
schedule_expression = "rate(30 minutes)"  # $0.36/month per LB
# Savings: 83%
2. Selective Metric Collection
Modify the Step Functions state machine to publish only critical metrics (requires custom state machine).
3. Use CloudWatch Metric Retention
Configure shorter retention for non-production metrics:
# Set 7-day retention for dev environment
aws logs put-retention-policy \
  --log-group-name /aws/vendedlogs/states/dev-hetzner-metrics \
  --retention-in-days 7
4. Schedule Collection Hours
Only collect metrics during business hours for non-production:
# Only Mon-Fri, 8 AM - 6 PM UTC
schedule_expression = "cron(*/5 8-18 ? * MON-FRI *)"
# Reduces executions from 8,640 to ~2,400/month
# Savings: ~72%
Security Best Practices
1. API Token Management
Use Read-Only Tokens:
# In Hetzner Cloud Console, create tokens with Read permissions only
# This prevents accidental infrastructure changes via compromised tokens
Rotate Tokens Regularly:
# Generate new token in Hetzner
NEW_TOKEN="new-token-value"

# Update Terraform variable
terraform apply -var="hetzner_api_token=$NEW_TOKEN"

# Old token is automatically replaced in Secrets Manager
Monitor Token Usage:
# CloudWatch alarm for authentication failures
resource "aws_cloudwatch_log_metric_filter" "auth_failures" {
  name           = "hetzner-api-auth-failures"
  log_group_name = "/aws/vendedlogs/states/hetzner-metrics"
  pattern        = "[... , status_code = 401, ...]"

  metric_transformation {
    name      = "HetznerAPIAuthFailure"
    namespace = "HetznerIntegration"
    value     = "1"
  }
}

resource "aws_cloudwatch_metric_alarm" "auth_failure_alert" {
  alarm_name          = "hetzner-api-unauthorized"
  comparison_operator = "GreaterThanThreshold"
  evaluation_periods  = 1
  metric_name         = "HetznerAPIAuthFailure"
  namespace           = "HetznerIntegration"
  period              = 300
  statistic           = "Sum"
  threshold           = 0
  alarm_description   = "Alert on Hetzner API authentication failures (token may be expired)"

  alarm_actions = [aws_sns_topic.security_alerts.arn]
}
2. IAM Least Privilege
Review and restrict IAM permissions:
# Restrict CloudWatch namespace
{
  "Effect": "Allow",
  "Action": "cloudwatch:PutMetricData",
  "Resource": "*",
  "Condition": {
    "StringEquals": {
      "cloudwatch:namespace": [
        "HetznerLoadBalancer",
        "HetznerServer"
      ]
    }
  }
}

# Restrict EventBridge Connection access
{
  "Effect": "Allow",
  "Action": "events:RetrieveConnectionCredentials",
  "Resource": "arn:aws:events:eu-central-1:123456789012:connection/hetzner-api/*"
}
3. Network Security
VPC Endpoints (for Step Functions in VPC):
# Use VPC endpoints to avoid internet egress
resource "aws_vpc_endpoint" "cloudwatch" {
  vpc_id            = var.vpc_id
  service_name      = "com.amazonaws.eu-central-1.monitoring"
  vpc_endpoint_type = "Interface"

  subnet_ids         = var.private_subnet_ids
  security_group_ids = [aws_security_group.vpc_endpoints.id]
}
API Rate Limiting:
Hetzner Cloud API has rate limits (3600 requests/hour). With 5-minute intervals per resource:
12 requests/hour per resource
Safe limit: ~300 resources per API token
4. Compliance & Audit
Enable CloudTrail for State Machine Execution:
resource "aws_cloudwatch_log_group" "state_machine_logs" {
  name              = "/aws/vendedlogs/states/hetzner-metrics"
  retention_in_days = 90  # Adjust based on compliance requirements

  kms_key_id = aws_kms_key.logs.arn  # Encrypt logs at rest
}

# Update Step Functions to use CloudWatch Logs
# (module should support logging_configuration parameter)
Tag Resources for Compliance:
module "hetzner_lb_metrics" {
  source = "KamranBiglari/hetzner-cloudwatch-integration/aws"
  # ... other config ...

  tags = {
    CostCenter  = "Infrastructure"
    Compliance  = "SOC2"
    DataClass   = "Metrics"
    Owner       = "[email protected]"
    Environment = "production"
  }
}
Troubleshooting Common Issues
Issue 1: No Metrics Appearing in CloudWatch
Symptoms:
- CloudWatch namespaces empty
- No datapoints when querying metrics
Diagnosis:
# Check Step Functions execution history
aws stepfunctions list-executions \
  --state-machine-arn $(terraform output -raw lb_state_machine_arn) \
  --max-results 5

# Get execution details
EXECUTION_ARN="arn:aws:states:eu-central-1:123456789012:execution:..."
aws stepfunctions describe-execution --execution-arn "$EXECUTION_ARN"

# Check for failed executions
aws stepfunctions list-executions \
  --state-machine-arn $(terraform output -raw lb_state_machine_arn) \
  --status-filter FAILED
Solutions:
-
Verify Hetzner API Token:
# Test token manually curl -H "Authorization: Bearer YOUR_TOKEN" \ https://api.hetzner.cloud/v1/load_balancers/123456/metrics?type=requests&start=2026-02-16T00:00:00Z&end=2026-02-16T01:00:00Z -
Check IAM Permissions:
- Ensure Step Functions role has
cloudwatch:PutMetricData - Verify
events:RetrieveConnectionCredentialspermission
- Ensure Step Functions role has
-
Verify Resource IDs:
# Check if load balancer exists
hcloud load-balancer describe 123456

# Or via API
curl -H "Authorization: Bearer YOUR_TOKEN" \
  https://api.hetzner.cloud/v1/load_balancers/123456
Issue 2: Step Functions Execution Timeout
Symptoms:
- Executions showing “TIMED_OUT” status
- Partial metrics collected
Diagnosis:
# Check execution duration
aws stepfunctions describe-execution \
  --execution-arn "$EXECUTION_ARN" \
  --query 'startDate,stopDate'

# Review CloudWatch Logs for errors
aws logs filter-log-events \
  --log-group-name /aws/vendedlogs/states/hetzner-metrics \
  --start-time $(date -d '1 hour ago' +%s)000
Solutions:
-
Increase State Machine Timeout (custom state machine modification needed)
-
Check Hetzner API Latency:
time curl -H "Authorization: Bearer YOUR_TOKEN" \ https://api.hetzner.cloud/v1/servers/789012/metrics?type=cpu -
Verify Network Connectivity (if Step Functions in VPC):
- Ensure NAT Gateway or VPC endpoints configured
- Check security group rules
Issue 3: High AWS Costs
Symptoms:
- Unexpected CloudWatch Metrics charges
- High Step Functions execution costs
Diagnosis:
# Count custom metrics
aws cloudwatch list-metrics \
  --namespace HetznerLoadBalancer \
  | jq '.Metrics | length'

aws cloudwatch list-metrics \
  --namespace HetznerServer \
  | jq '.Metrics | length'

# Count Step Functions executions
aws stepfunctions describe-state-machine \
  --state-machine-arn $(terraform output -raw lb_state_machine_arn) \
  --query 'stateMachineArn' \
  | xargs -I {} aws cloudwatch get-metric-statistics \
    --namespace AWS/States \
    --metric-name ExecutionsSucceeded \
    --dimensions Name=StateMachineArn,Value={} \
    --start-time $(date -d '30 days ago' +%Y-%m-%dT%H:%M:%S) \
    --end-time $(date -u +%Y-%m-%dT%H:%M:%S) \
    --period 2592000 \
    --statistics Sum
Solutions:
-
Reduce Collection Frequency:
schedule_expression = "rate(15 minutes)" # Down from 5 minutes # Reduces costs by ~67% -
Disable Non-Production Monitoring:
create_scheduler = var.environment == "production" ? true : false -
Use Cost Allocation Tags:
tags = {
  CostCenter = "infrastructure-monitoring"
}
Then track in AWS Cost Explorer.
Issue 4: Metric Data Gaps
Symptoms:
- Intermittent missing datapoints
- Irregular metric intervals
Diagnosis:
# Check for failed executions
aws stepfunctions list-executions \
  --state-machine-arn $(terraform output -raw server_state_machine_arn) \
  --status-filter FAILED \
  --max-results 20

# Check EventBridge Scheduler success rate
aws scheduler get-schedule \
  --name "hetzner-server-metrics-schedule"
Solutions:
-
Enable Step Functions Retry: Modify state machine to add retry logic (custom state machine)
-
Check Hetzner API Rate Limits:
# Review response headers curl -I -H "Authorization: Bearer YOUR_TOKEN" \ https://api.hetzner.cloud/v1/servers/789012/metrics?type=cpu # Look for: X-RateLimit-Remaining -
Monitor EventBridge Scheduler:
resource "aws_cloudwatch_metric_alarm" "scheduler_failed" {
  alarm_name          = "hetzner-scheduler-failures"
  comparison_operator = "GreaterThanThreshold"
  evaluation_periods  = 1
  metric_name         = "TargetErrorCount"
  namespace           = "AWS/Scheduler"
  period              = 300
  statistic           = "Sum"
  threshold           = 0

  dimensions = {
    ScheduleName = "hetzner-server-metrics-schedule"
  }

  alarm_actions = [aws_sns_topic.infrastructure_alerts.arn]
}
Real-World Use Cases
Use Case 1: Cost-Optimized Frontend Hosting
Scenario: Company uses Hetzner for static asset CDN (lower bandwidth costs) and AWS for dynamic API backend.
Challenge: Need unified monitoring to correlate frontend performance (Hetzner) with backend latency (AWS).
Solution:
# Monitor Hetzner load balancer serving static assets
module "cdn_lb_metrics" {
  source  = "KamranBiglari/hetzner-cloudwatch-integration/aws"
  version = "~> 1.0"

  hetzner_cloud_api_token = var.hetzner_api_token
  metric_type             = "loadbalancer"
  name                    = "cdn-lb-metrics"

  data = {
    loadbalancer_id = var.hetzner_cdn_lb_id
  }

  create_scheduler    = true
  schedule_expression = "rate(1 minute)"  # High frequency for CDN
}

# Create correlation dashboard
resource "aws_cloudwatch_dashboard" "frontend_backend" {
  dashboard_name = "FullStackPerformance"

  dashboard_body = jsonencode({
    widgets = [
      {
        type = "metric"
        properties = {
          metrics = [
            ["HetznerLoadBalancer", "RequestsPerSecond", { label = "CDN Requests (Hetzner)" }],
            ["AWS/ApplicationELB", "RequestCount", { stat = "Sum", label = "API Requests (AWS)" }]
          ]
          title = "Frontend vs Backend Traffic"
        }
      }
    ]
  })
}Benefits:
- Correlate CDN traffic spikes with backend load
- Identify caching effectiveness
- Unified alerting for full-stack incidents
Use Case 2: Database Server Monitoring
Scenario: PostgreSQL databases hosted on Hetzner dedicated servers for cost savings.
Challenge: Need to monitor database server resources alongside AWS RDS instances.
Solution:
# Monitor Hetzner database servers
module "db_servers" {
  source   = "KamranBiglari/hetzner-cloudwatch-integration/aws"
  version  = "~> 1.0"
  for_each = var.hetzner_db_servers

  hetzner_cloud_api_token = var.hetzner_api_token
  metric_type             = "server"
  name                    = "db-${each.key}"

  data = {
    server_id = each.value
  }

  create_scheduler    = true
  schedule_expression = "rate(1 minute)"  # Database needs high frequency

  tags = {
    Role     = "database"
    DBEngine = "postgresql"
  }
}

# Alert on database server resource saturation
resource "aws_cloudwatch_metric_alarm" "db_cpu_high" {
  for_each = var.hetzner_db_servers

  alarm_name          = "db-${each.key}-cpu-high"
  comparison_operator = "GreaterThanThreshold"
  evaluation_periods  = 2
  metric_name         = "CPUUtilization"
  namespace           = "HetznerServer"
  period              = 60
  statistic           = "Average"
  threshold           = 85

  dimensions = {
    ServerId = each.value
  }

  alarm_actions = [aws_sns_topic.database_alerts.arn]
}Benefits:
- Unified database monitoring across clouds
- Consistent alerting for all database resources
- Cost savings vs AWS RDS while maintaining observability
Use Case 3: Multi-Region Failover Monitoring
Scenario: Primary infrastructure in AWS, disaster recovery in Hetzner.
Challenge: Monitor DR resources without maintaining separate monitoring infrastructure.
Solution:
# Monitor DR load balancer in Hetzner
module "dr_lb_metrics" {
  source  = "KamranBiglari/hetzner-cloudwatch-integration/aws"
  version = "~> 1.0"

  hetzner_cloud_api_token = var.hetzner_api_token
  metric_type             = "loadbalancer"
  name                    = "dr-lb-metrics"

  data = {
    loadbalancer_id = var.hetzner_dr_lb_id
  }

  create_scheduler    = true
  schedule_expression = "rate(5 minutes)"
}

# Composite alarm for failover health
resource "aws_cloudwatch_composite_alarm" "dr_readiness" {
  alarm_name    = "disaster-recovery-readiness"
  alarm_actions = [aws_sns_topic.critical_alerts.arn]

  alarm_rule = join(" AND ", [
    "ALARM(hetzner-dr-lb-health)",           # DR LB is healthy
    "NOT ALARM(aws-primary-region-health)"   # Primary is down
  ])
}Benefits:
- Monitor DR resources from primary AWS account
- Automated failover readiness checks
- Single alerting pipeline for multi-cloud DR
Comparison: Alternative Monitoring Solutions
| Solution | Hetzner → CloudWatch (This Module) | Grafana Cloud | Datadog | Prometheus + Thanos |
|---|---|---|---|---|
| Setup Complexity | Low (Terraform module) | Medium | Low | High |
| Cost (10 servers) | ~$34/month | ~$50/month | ~$150/month | Self-hosted ($?) |
| AWS Native Integration | ✅ Excellent | ⚠️ Limited | ✅ Good | ⚠️ Limited |
| Unified Dashboards | ✅ CloudWatch | ✅ Grafana | ✅ Datadog | ✅ Grafana |
| Alerting | CloudWatch Alarms | Grafana Alerts | Datadog Monitors | Alertmanager |
| Retention | 15 months (CW) | 13 months | 15 months | Configurable |
| Learning Curve | Low (if familiar with AWS) | Medium | Low | High |
| Vendor Lock-in | AWS | Grafana Labs | Datadog | None |
| Multi-Cloud Support | AWS + Hetzner | All clouds | All clouds | All clouds |
Conclusion
Integrating Hetzner Cloud metrics into AWS CloudWatch provides a pragmatic solution for hybrid cloud observability without the complexity and cost of third-party monitoring platforms. By leveraging serverless AWS services (Step Functions, EventBridge, CloudWatch), you gain:
Key Benefits:
- Unified Observability: Single pane of glass for all infrastructure
- Cost Efficiency: ~$2-3/resource/month vs $15-20/resource with commercial tools
- AWS Native: Seamless integration with existing CloudWatch dashboards and alarms
- Infrastructure as Code: Full Terraform automation for repeatable deployments
- Serverless: No monitoring infrastructure to manage or patch
- Secure: API tokens in Secrets Manager, least-privilege IAM, encrypted transit
When to Use This Solution:
- You have hybrid infrastructure across AWS and Hetzner
- You want to leverage existing AWS CloudWatch expertise
- You need cost-effective monitoring ($2-3/resource/month)
- You prefer infrastructure as code (Terraform)
- You want AWS-native alerting and automation
When to Consider Alternatives:
- You need monitoring across 3+ cloud providers → Grafana Cloud or Datadog
- You require advanced anomaly detection → Datadog or AWS CloudWatch Insights
- You have complex custom metric requirements → Prometheus/Thanos
- You need real-time alerting (< 1 minute) → Direct Hetzner API integration
This Terraform module solves a real pain point for hybrid cloud teams, enabling centralized monitoring without vendor lock-in to expensive observability platforms.
Additional Resources
- GitHub Repository: terraform-aws-hetzner-cloudwatch-integration
- Terraform Registry: KamranBiglari/hetzner-cloudwatch-integration/aws
- Hetzner Cloud API: docs.hetzner.cloud
- AWS Step Functions: docs.aws.amazon.com/step-functions
- CloudWatch Custom Metrics: docs.aws.amazon.com/AmazonCloudWatch/latest/monitoring/publishingMetrics.html
Have questions or suggestions? Open an issue on GitHub or reach out at [email protected]